Interactive Family-Network Visualization
Family trees are not really trees — they are complex, layered family networks. This project presents an interactive visualization approach for large-scale family-network data, supporting hundreds of people, multiple relationship types, and readable generation-based layouts. The system combines graph preprocessing, relationship weighting, crossing reduction, and compact layout methods to make complex family structures easier to explore, edit, and understand. It was inspired in part by my work on family trees for the families of the October 7 hostages, and reflects my broader focus on turning complex human data into clear, interactive visual analytics tools.
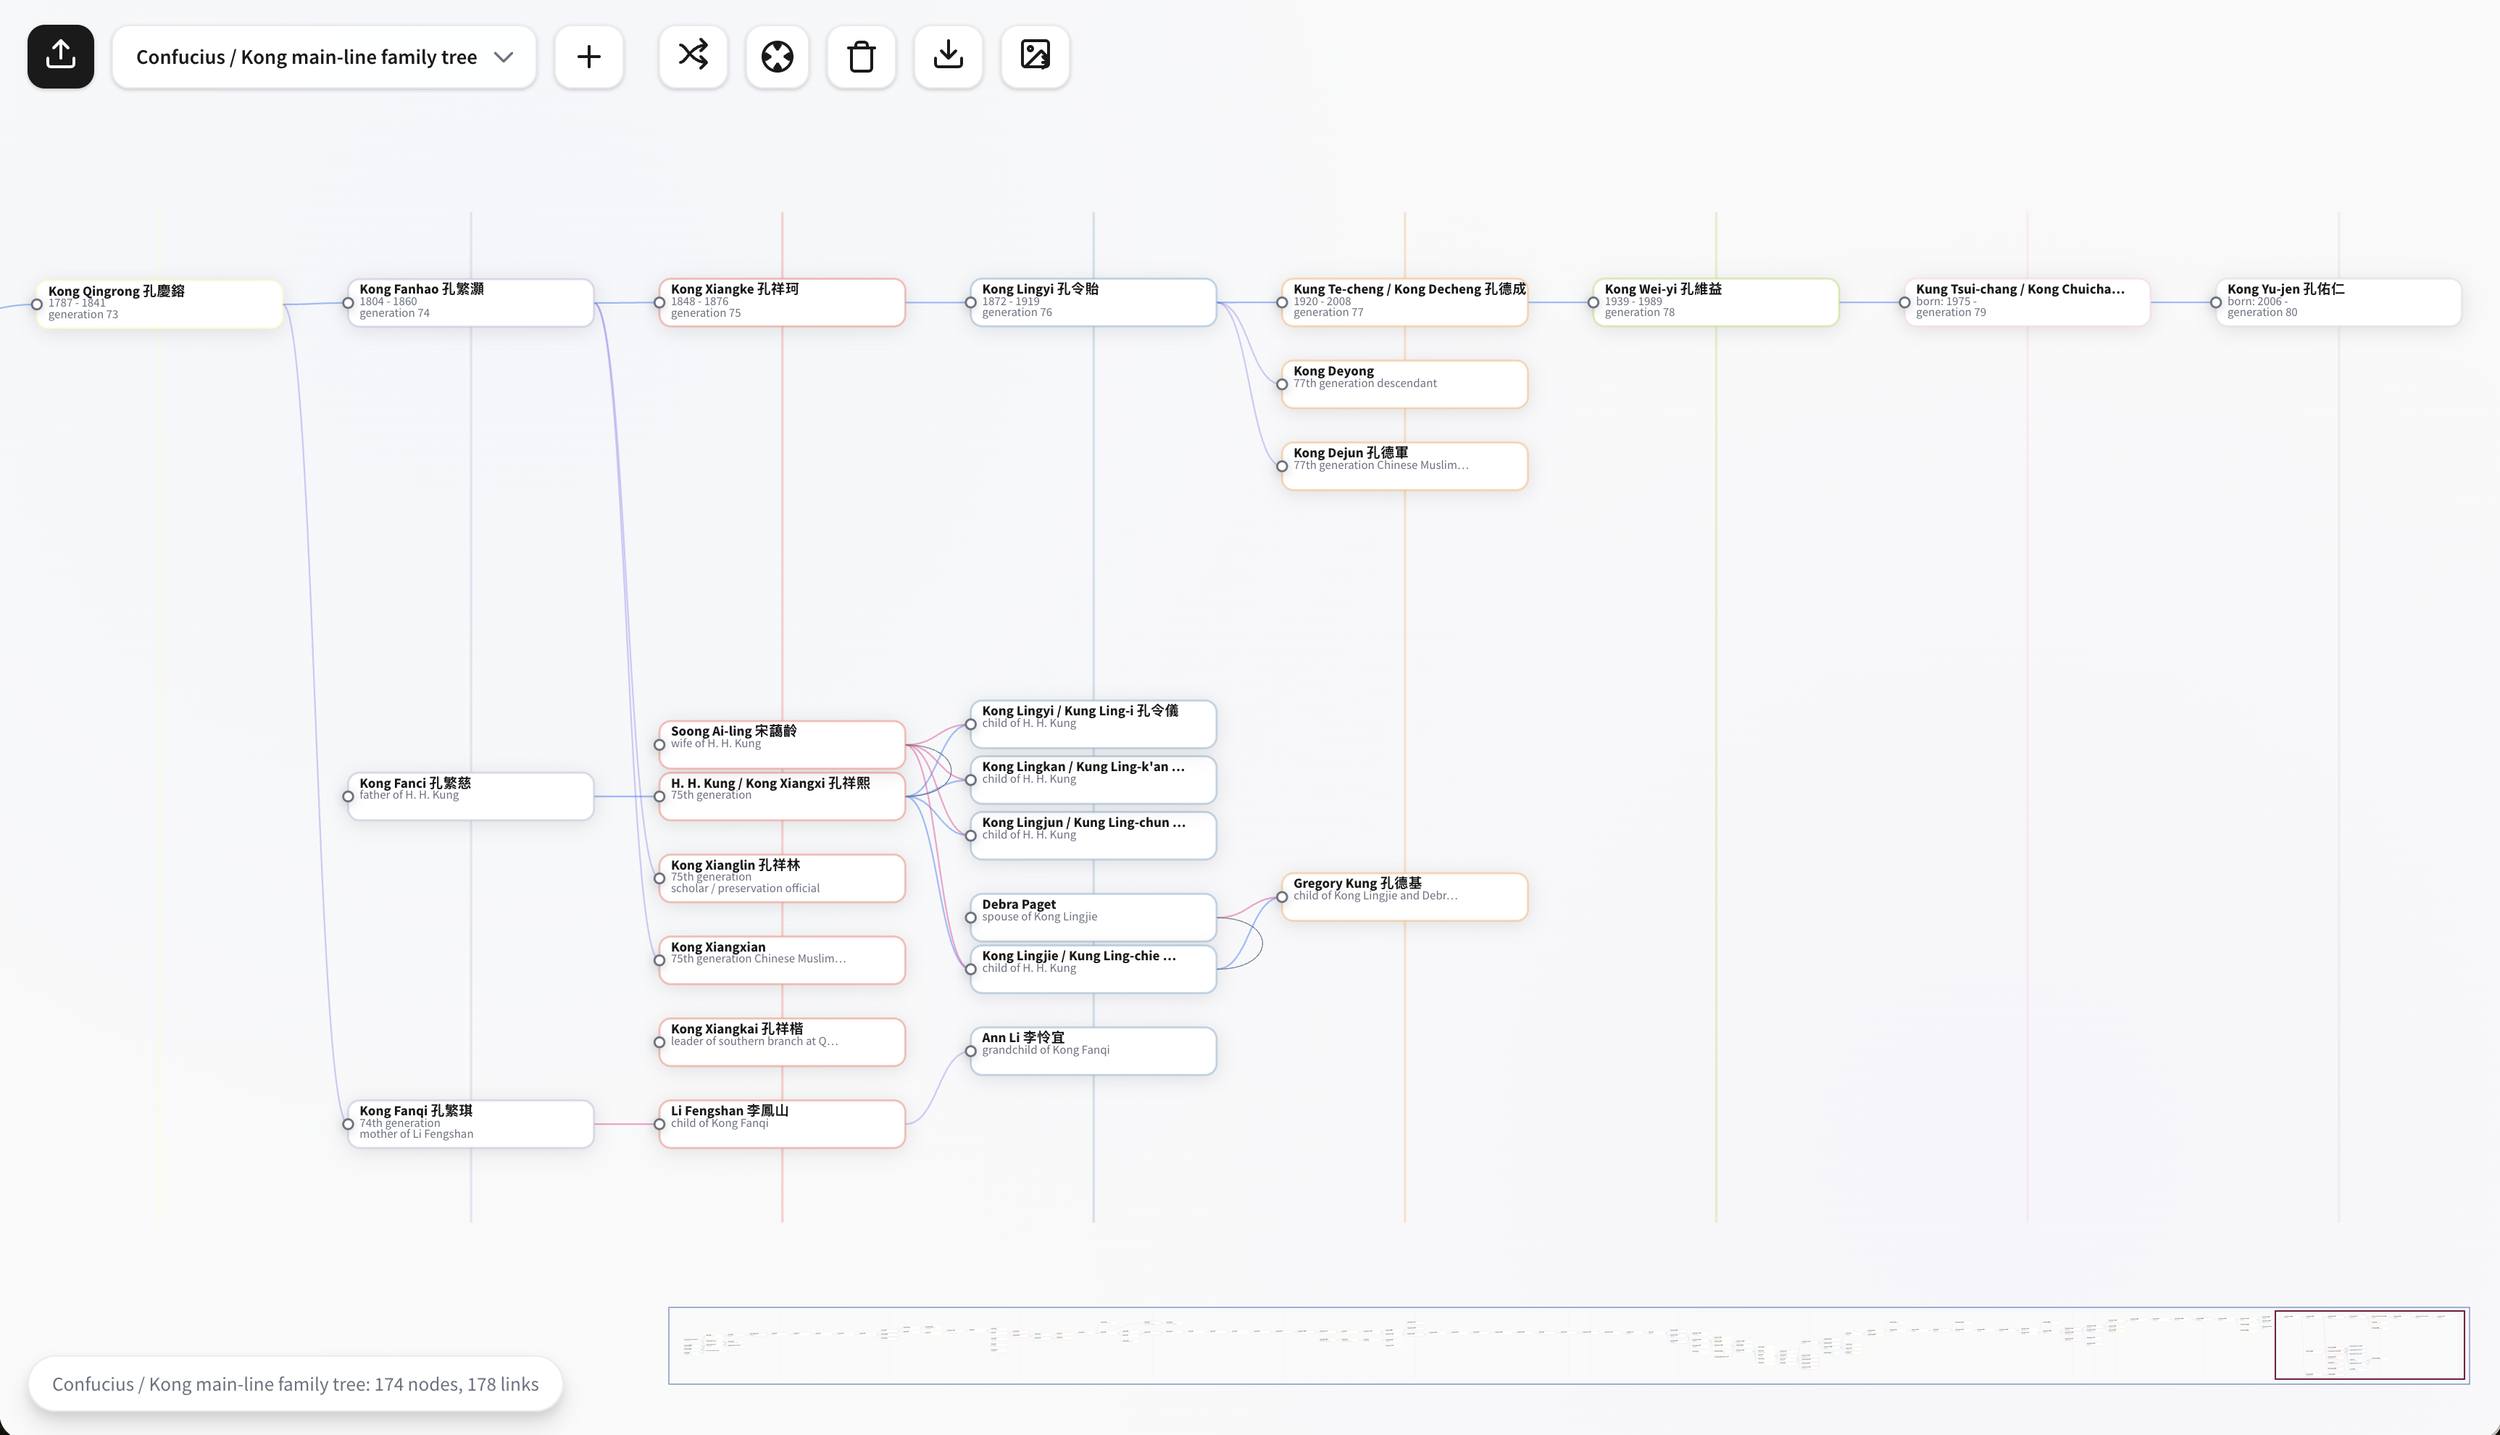
Confucius / Kong family line, showing the last 8 generations, out of 81 registered generations, indicated at the bottom.

The example on the website uses Queen Victoria’s descendants as a stress-test case, with hundreds of people, multiple European royal branches, dynastic marriages, and succession links.
Approach
Family trees are often presented as simple hierarchical trees. In practice, real family structures are not trees — they are constrained, layered graphs. They include parent-child relationships, marriages, remarriages, informal or uncertain relations, adoption, dynastic links, succession lines, and cross-branch connections. When the number of people grows, conventional genealogy diagrams quickly become hard to read.
This project explores a scalable approach for visualizing complex family networks as structured, interactive diagrams.
The visualization is designed to support hundreds of people while preserving readability. Nodes are organized by generation, but the layout is not limited to a strict tree model. Instead, the system treats the data as a graph with different relationship types and layout constraints. Relationship types can be weighted differently, allowing strong structural relations such as parent-child links to influence the layout more than secondary or contextual links.
A key focus of the project is layout quality. The layout process combines graph preprocessing, generation-aware ordering, relationship-type weighting, crossing reduction, spouse and family-unit handling, and compact coordinate assignment inspired by layered graph layout methods such as Sugiyama-style layouts and Brandes-Köpf coordinate assignment. The goal is to keep related people visually close, reduce unnecessary edge crossings, avoid excessive vertical stretching, and maintain a stable readable structure even as the graph grows.
The system also supports multiple relationship types beyond ancestry. Links can represent father, mother, marriage, dynastic marriage, succession, adoption, informal relations, uncertain connections, or project-specific relationship categories. This makes the visualization suitable for real-world family data, where the structure is often incomplete, ambiguous, or historically complex.
The prototype includes an interactive editor for loading, editing, exploring, and exporting family-network data. Users can add people, create relationships, define new link types, adjust generations, inspect complex branches, and export the resulting structure as JSON. This makes the tool useful both as a visualization and as a data-curation environment.
Main capabilities
Visualization of large family networks with hundreds of nodes
Generation-based layout with graph-aware positioning
Support for many relationship types, not only ancestry
Weighted relationship handling for layout and visual encoding
Interactive exploration of dense family structures
Editable nodes and relationships
Custom link-type definitions
JSON import and export
Layout designed for readability, not only correctness
Suitable for historical, genealogical, social, and investigative family-network data
Example use case
The example shown here uses descendants of Queen Victoria as a complex stress-test case. It includes multiple European royal branches, dynastic marriages, succession lines, and several generations of descendants. This type of data is challenging because it combines ancestry, marriage, political lineage, and cross-family connections. A simple tree layout is not sufficient; the structure needs to be handled as a layered family graph.
Potential use cases
Genealogy and family-history exploration
Historical dynasty visualization
Royal-family and succession-line analysis
Archival research
Memorial and remembrance projects
Social-history visualization
Investigative family-network mapping
Education and public-history storytelling
Data curation for complex relationship networks
The project is especially meaningful to me because of previous work on family trees for the families of the October 7 hostages. That work highlighted how important it is to represent family structures clearly, respectfully, and accurately — and how quickly conventional tree diagrams break down when real relationships become complex.
This prototype is part of my broader work in visual analytics: transforming complex human data into interactive visual structures that can be explored, understood, and communicated.