MapCraft
AI-assisted cartographic design for data visualization
MapCraft is an AI-assisted vector map styling and export system designed for one core idea:
maps should support the data — not interfere with it.
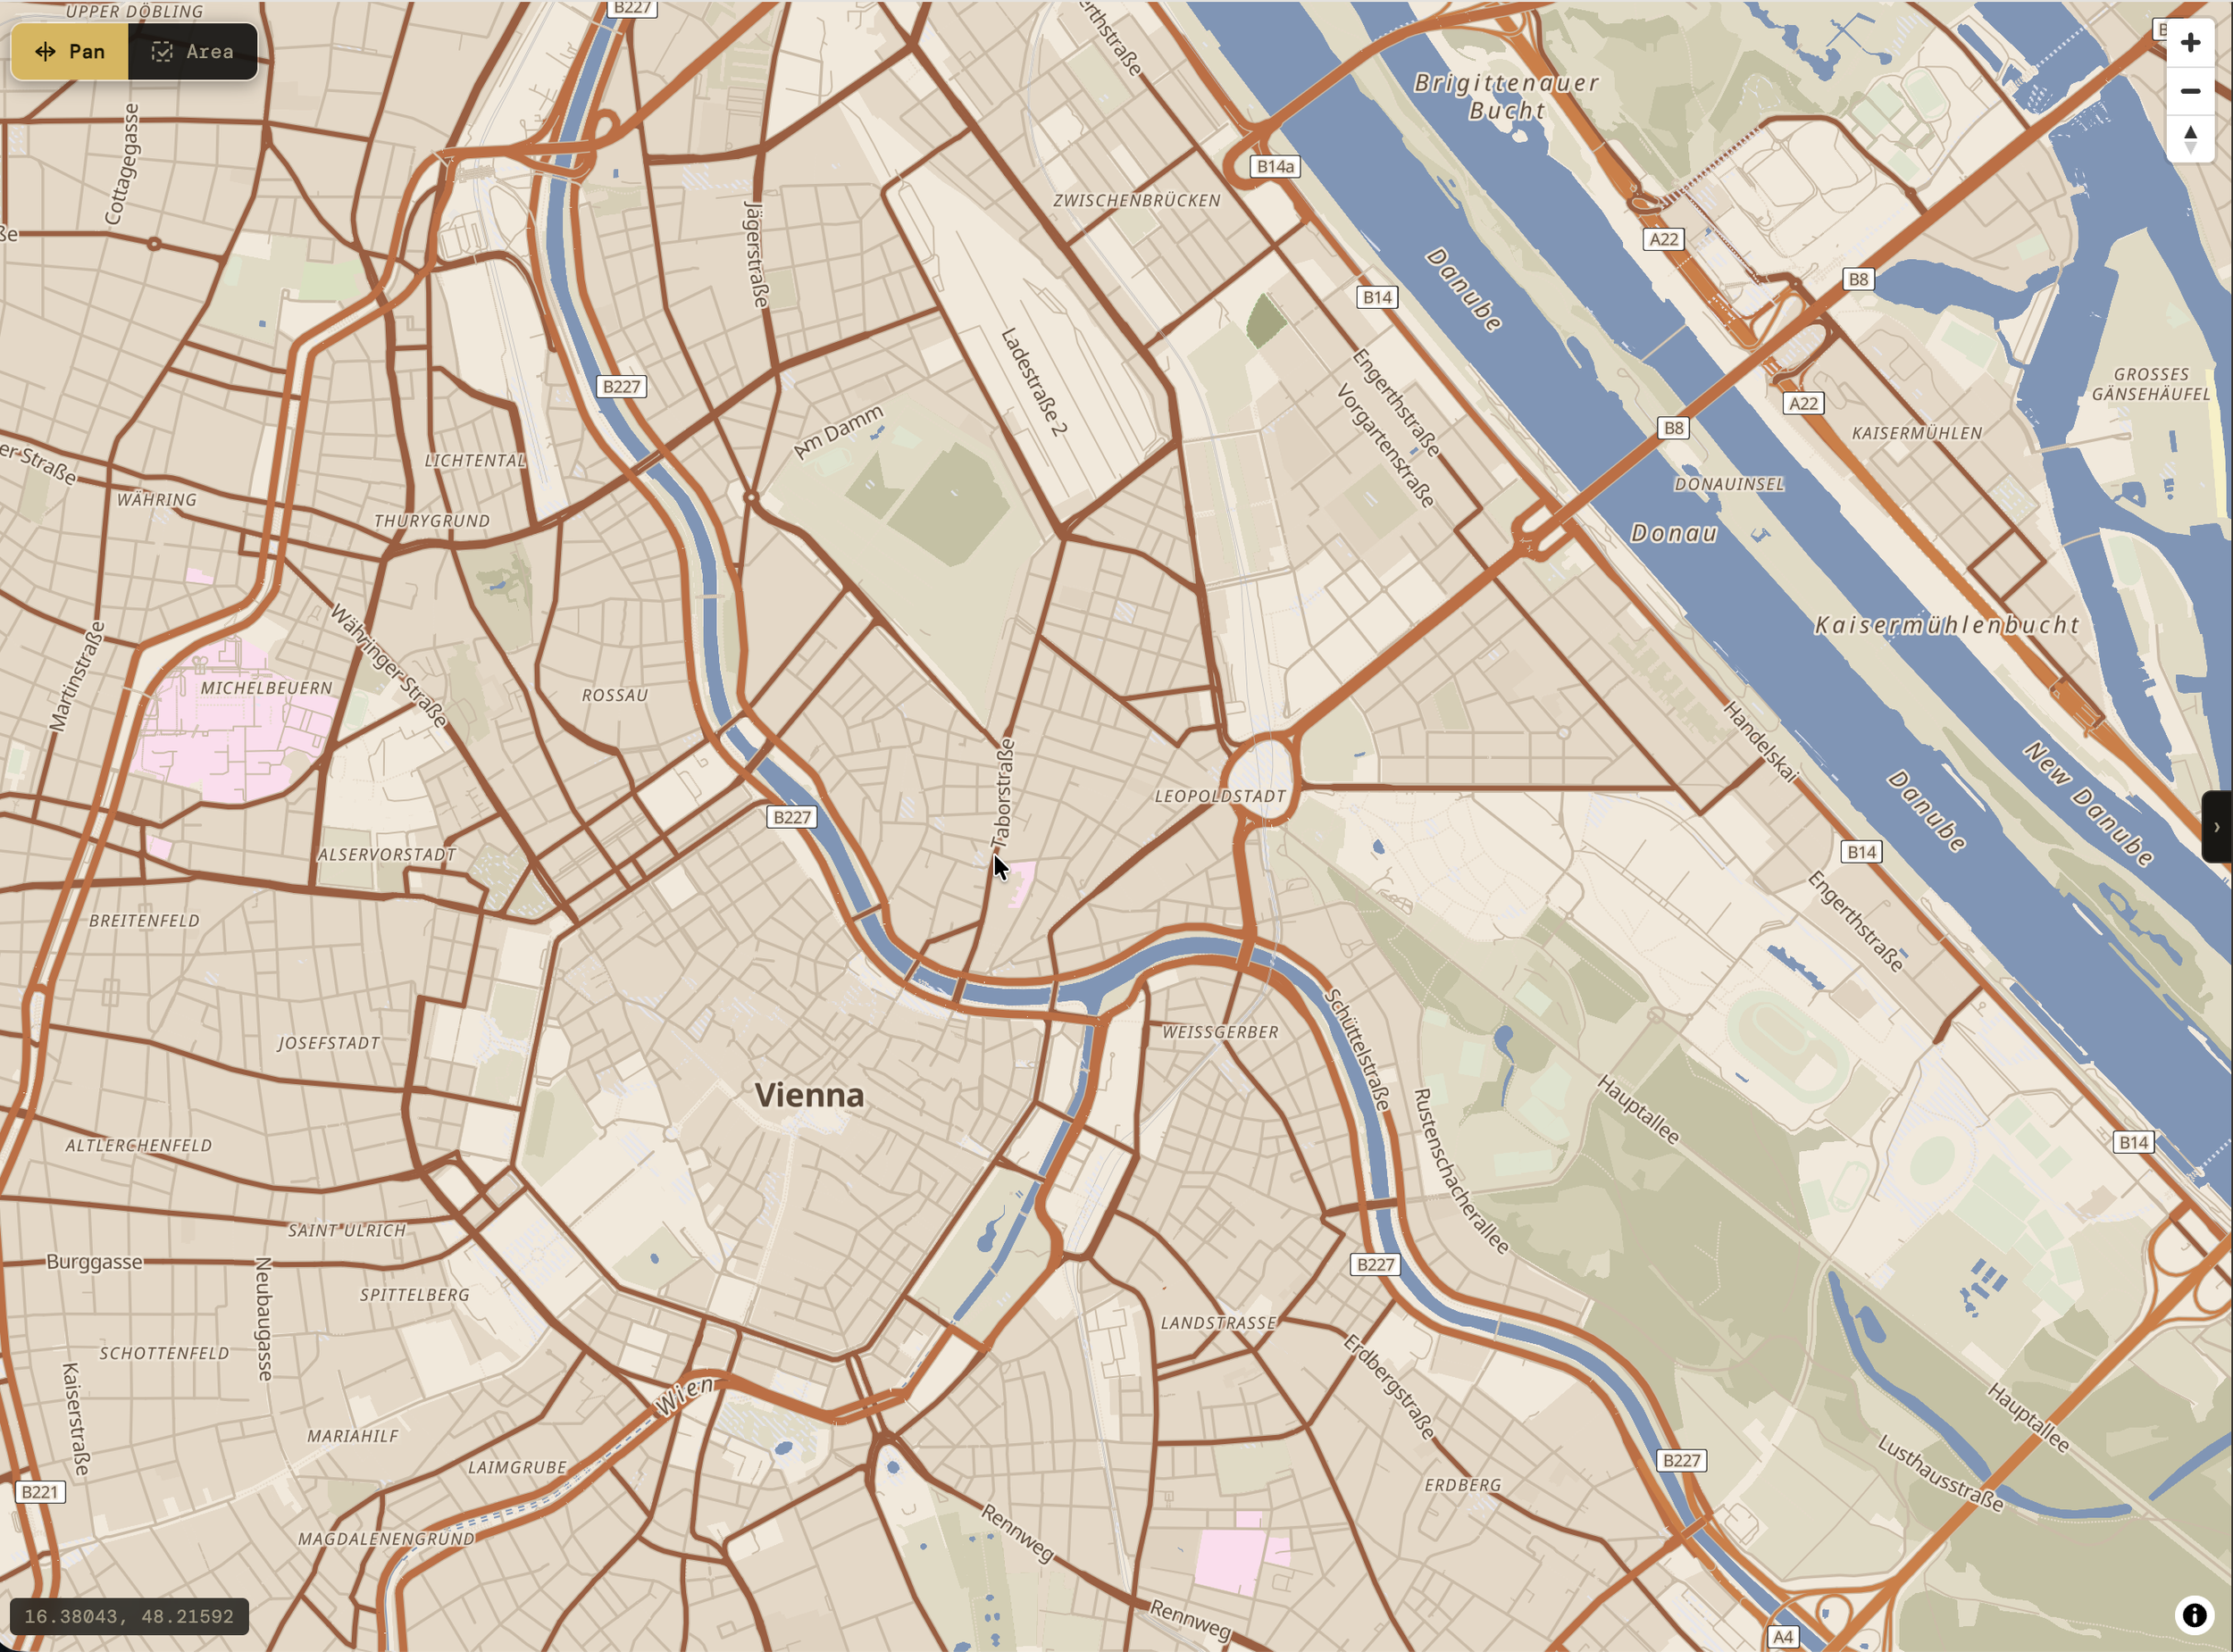
Traditional base-maps are optimized for navigation: dense labels, strong colors, and visually dominant cartography that often competes with analytical overlays and visual encodings.
MapCraft allows designers, cartographers, and data owners to generate and refine cartographic styles interactively instead of manually tuning dozens of semantic map layers.
Describe a visual direction, atmosphere, or artwork to the AI assistant:
“Nordic Fog”, “Picasso Guernica”, or “Van Gogh Sunflowers”.
The system generates a complete cartographic theme including colors, semantic hierarchy, and zoom visibility defaults — all editable in real time and exportable as high-resolution vector maps. Moreover, you can export a map-style directly to be used in your MapLibre definition.
Check out the tool: MapCraft
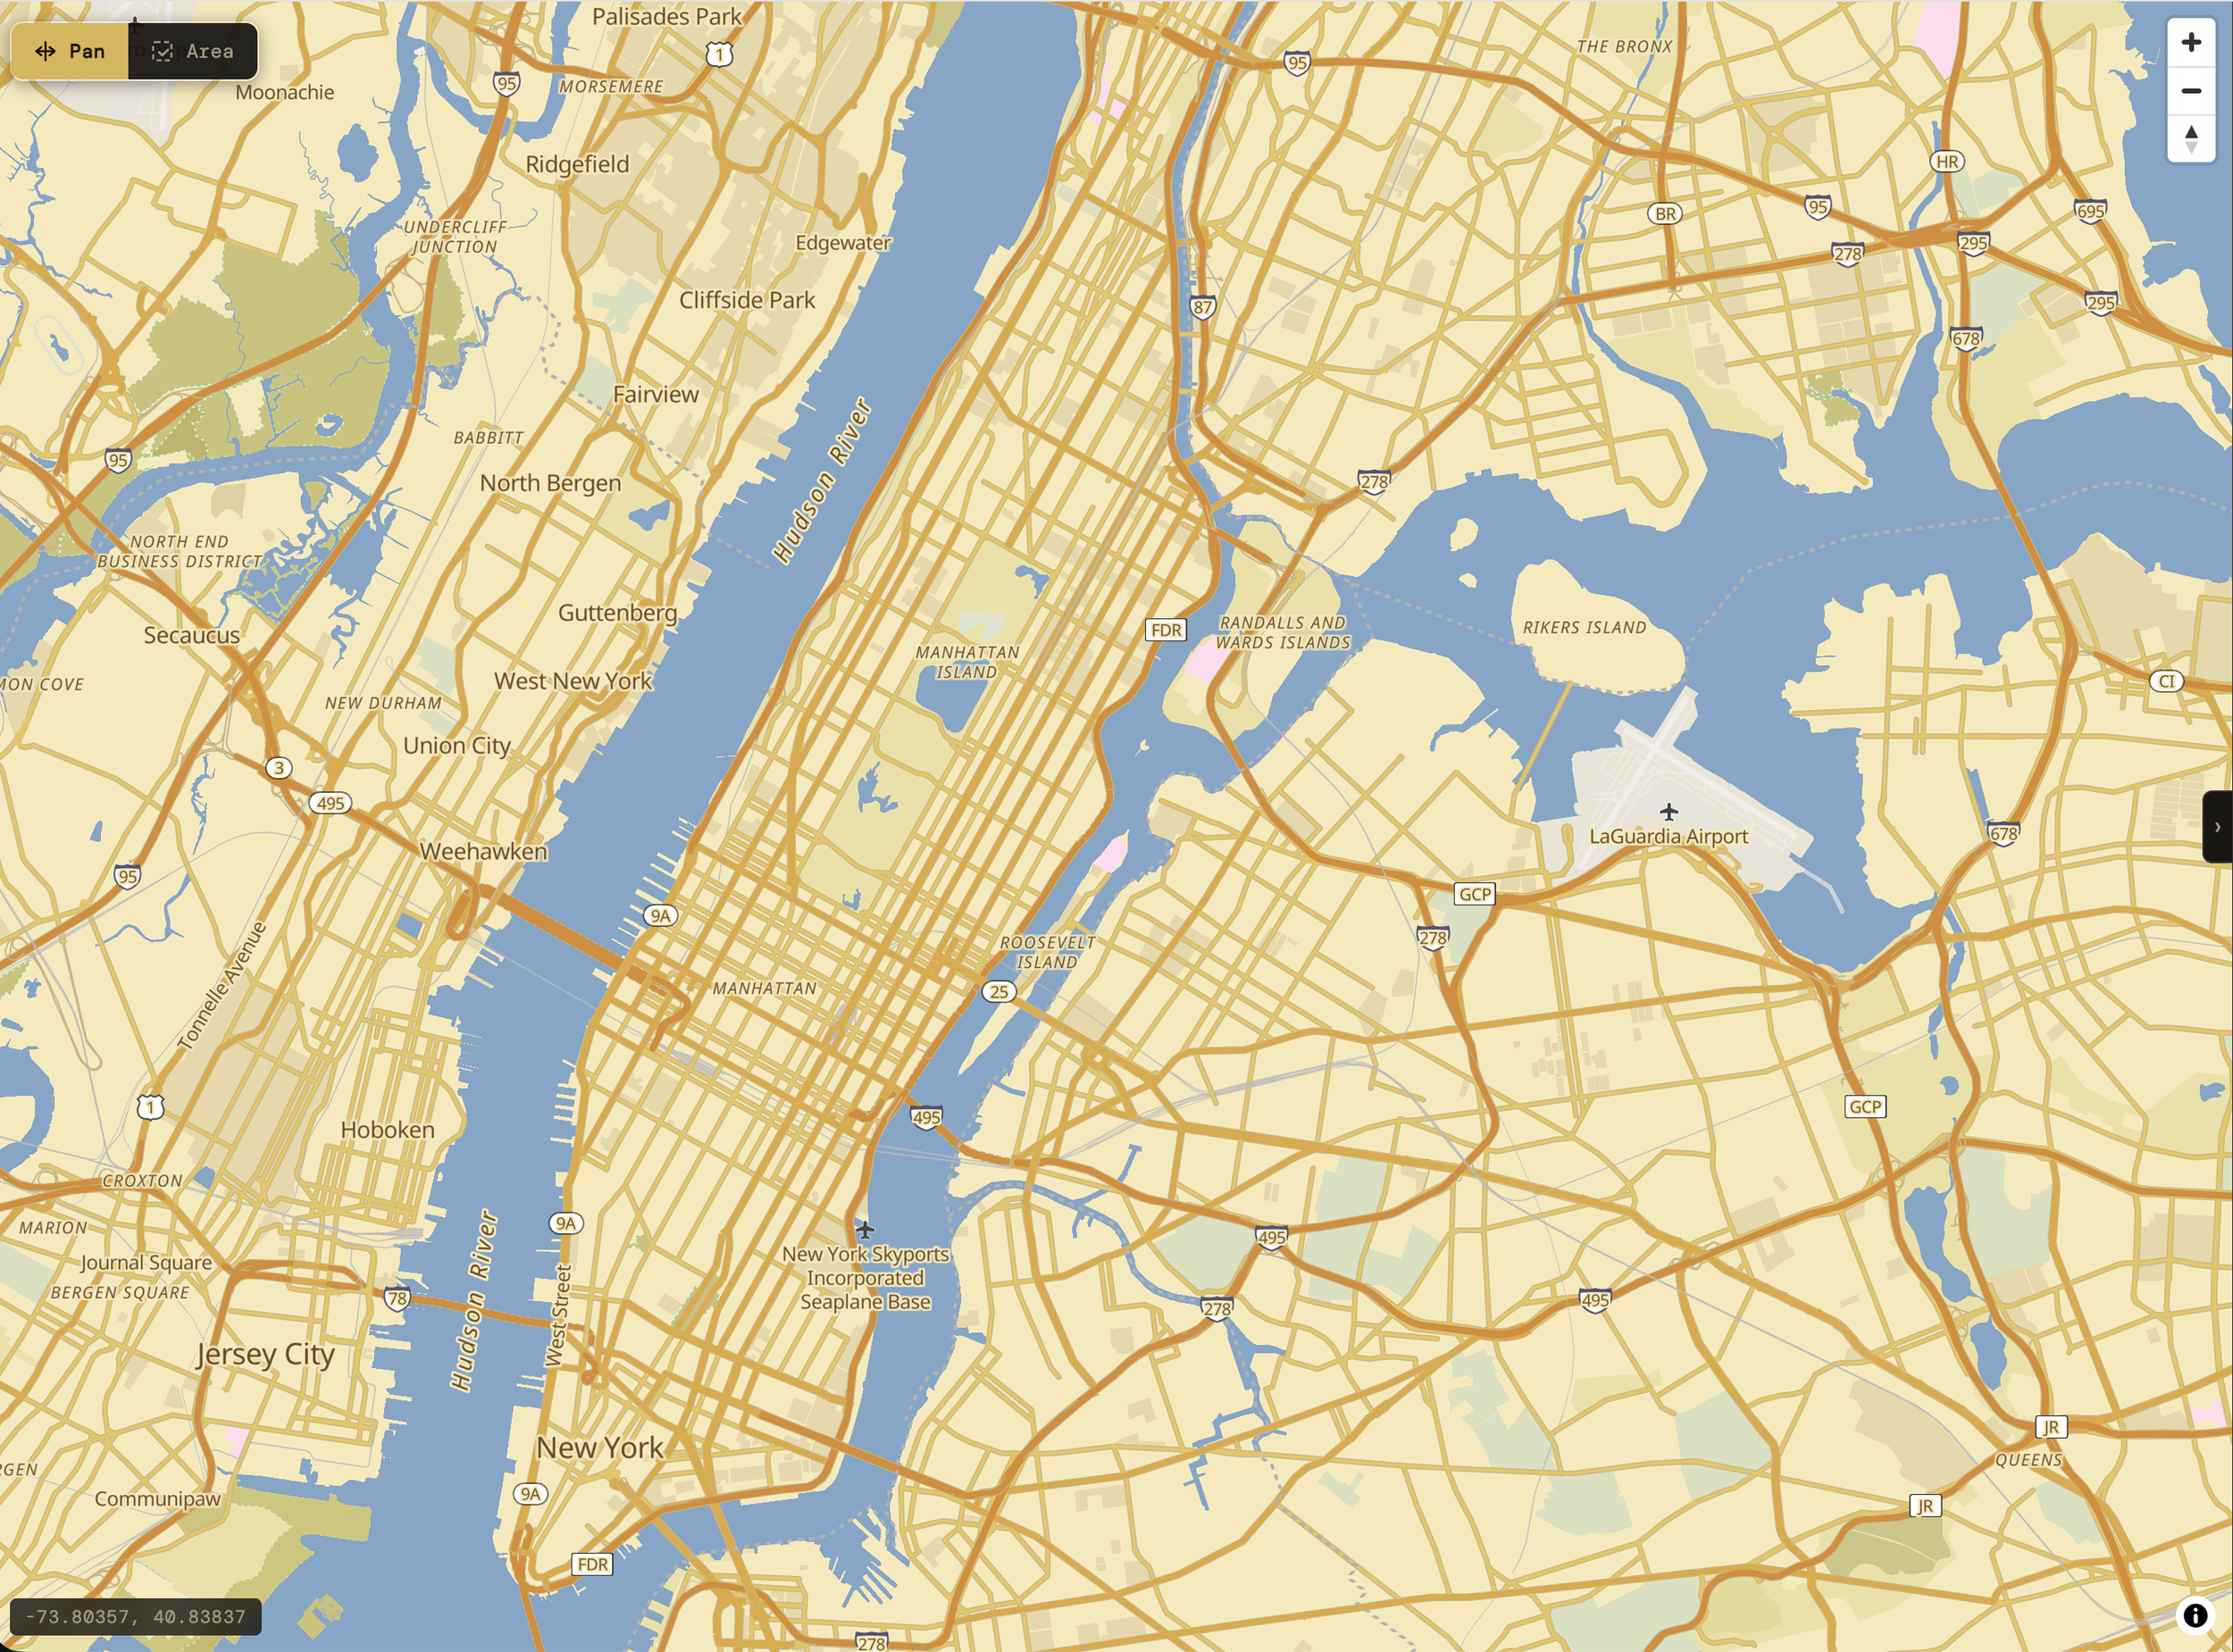
Van Gogh - Sunflowers - Strong yellows, ochres, and warm oranges inspired by Van Gogh’s sunflower series. Vibrant while preserving semantic structure and readability.
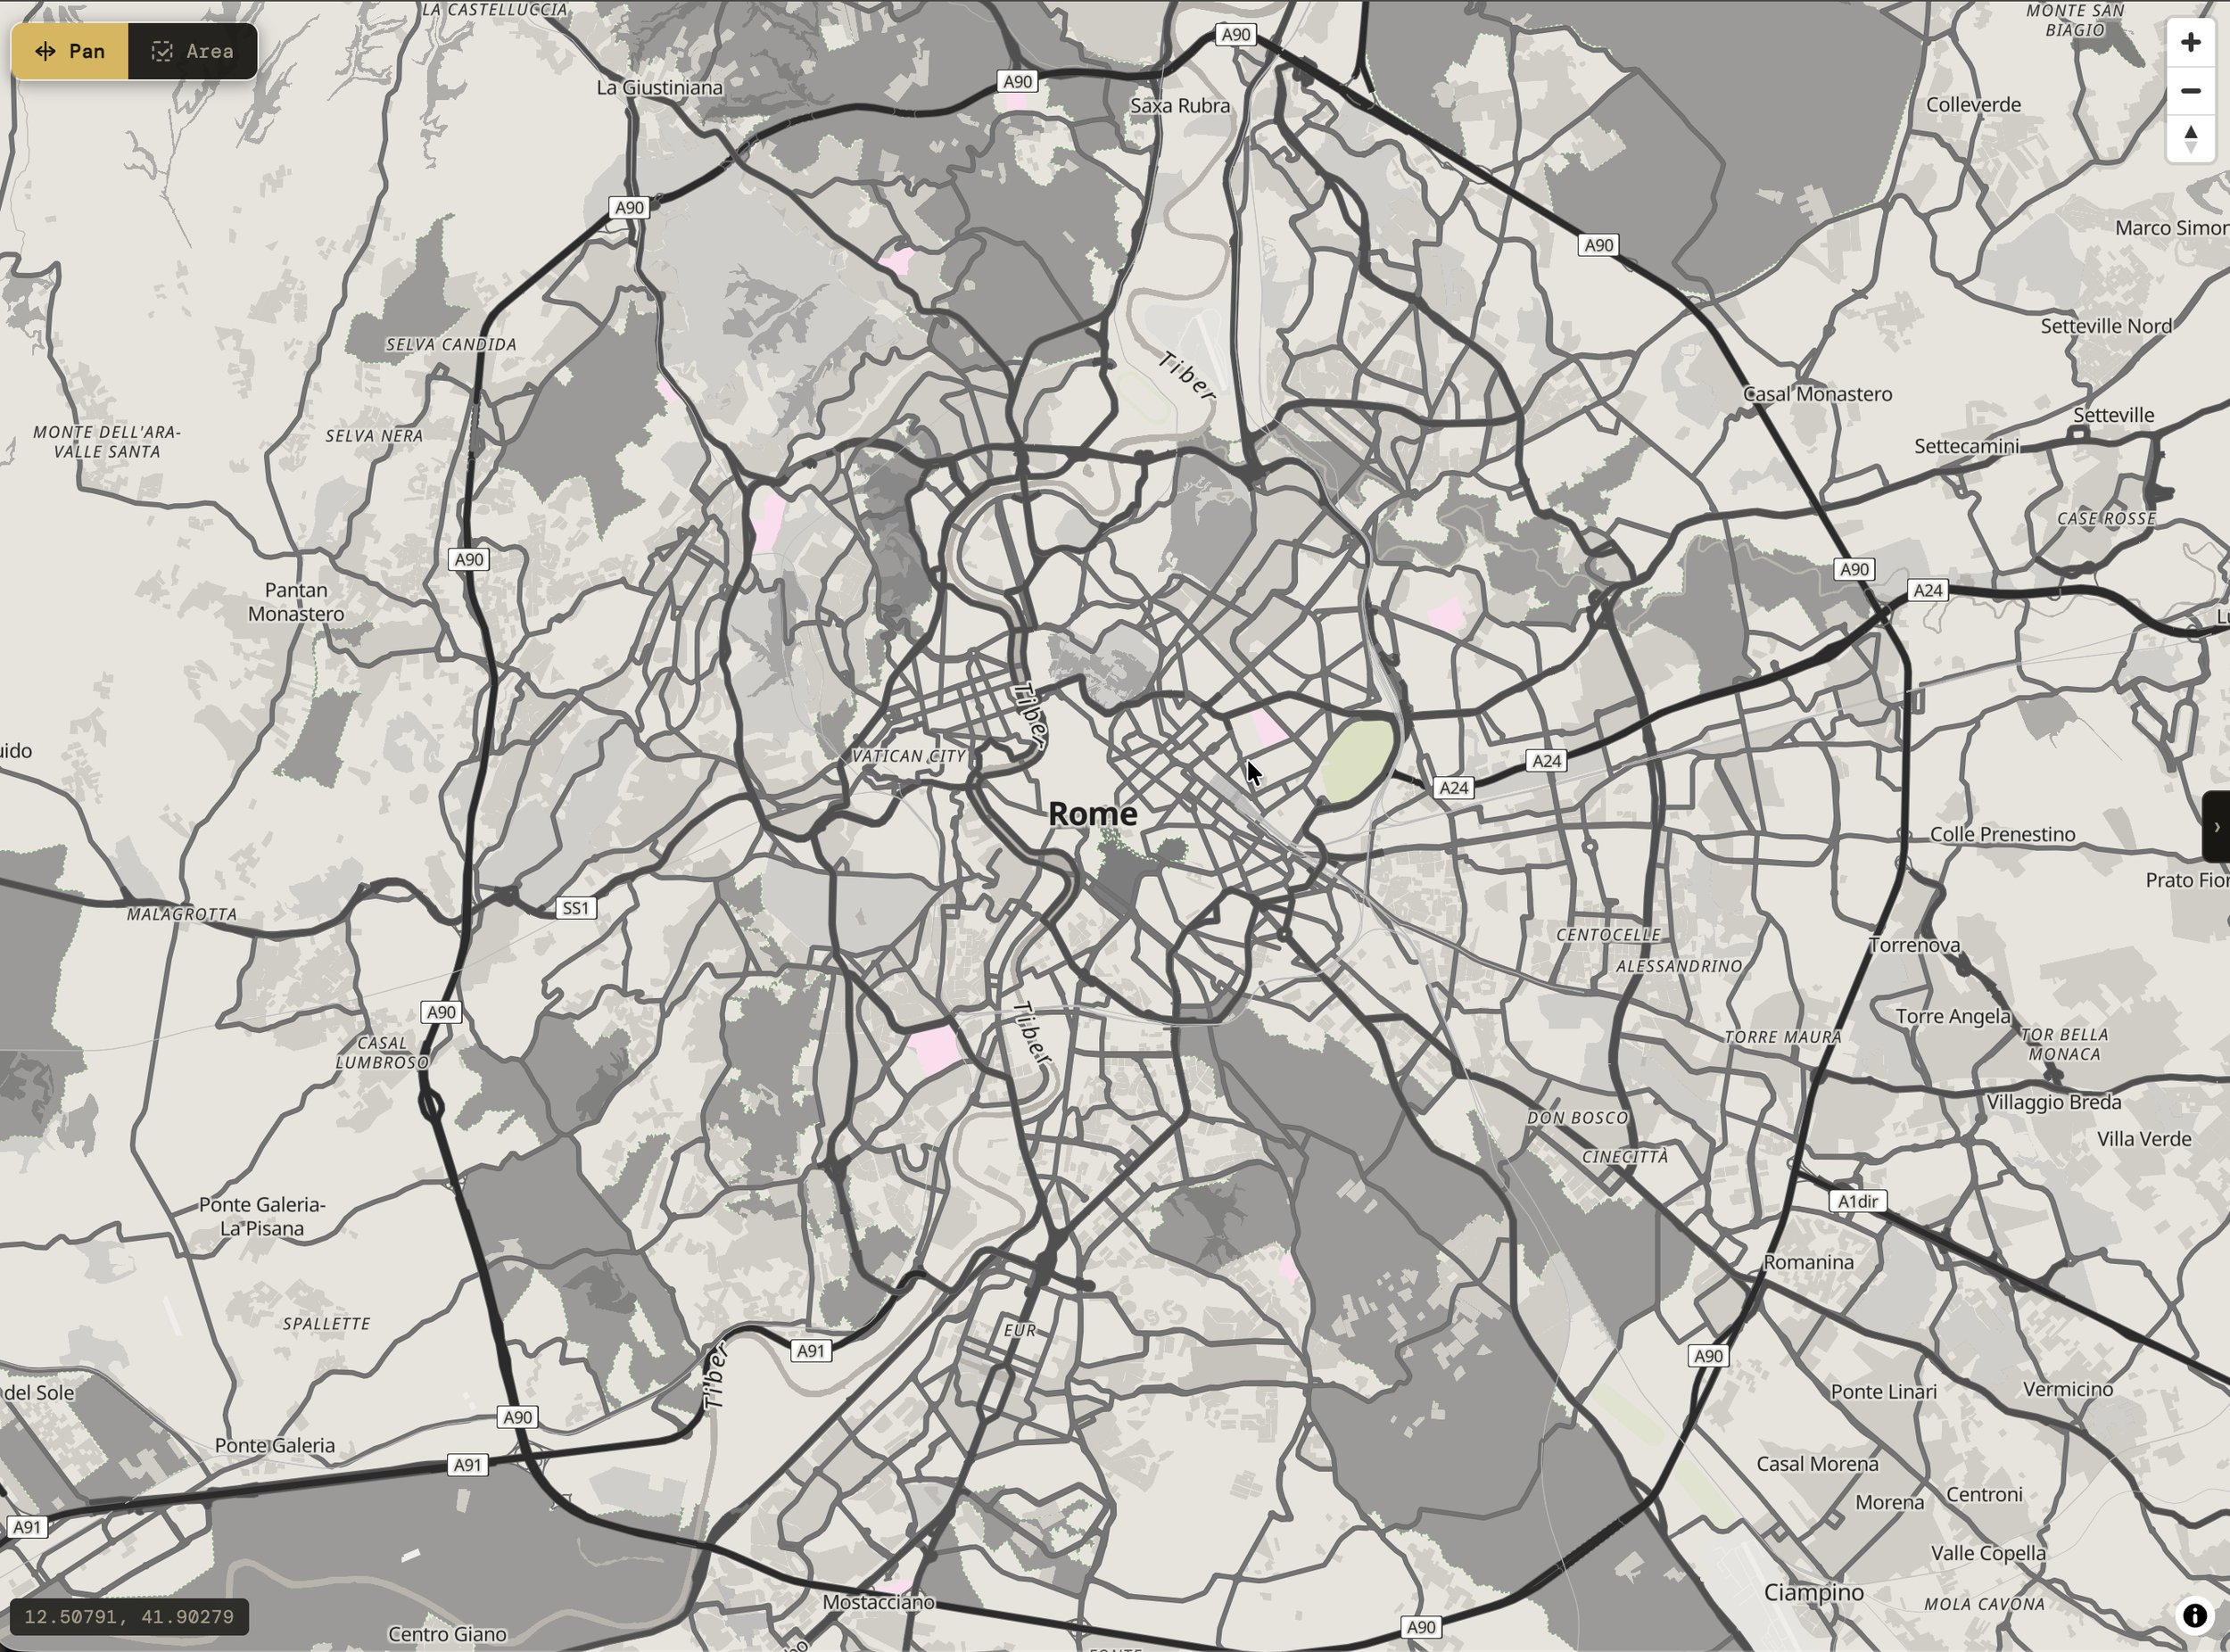
Picasso - Guernica - A monochromatic grayscale theme inspired by Guernica. Dramatic tonal hierarchy with strong structural emphasis and minimal color distraction.
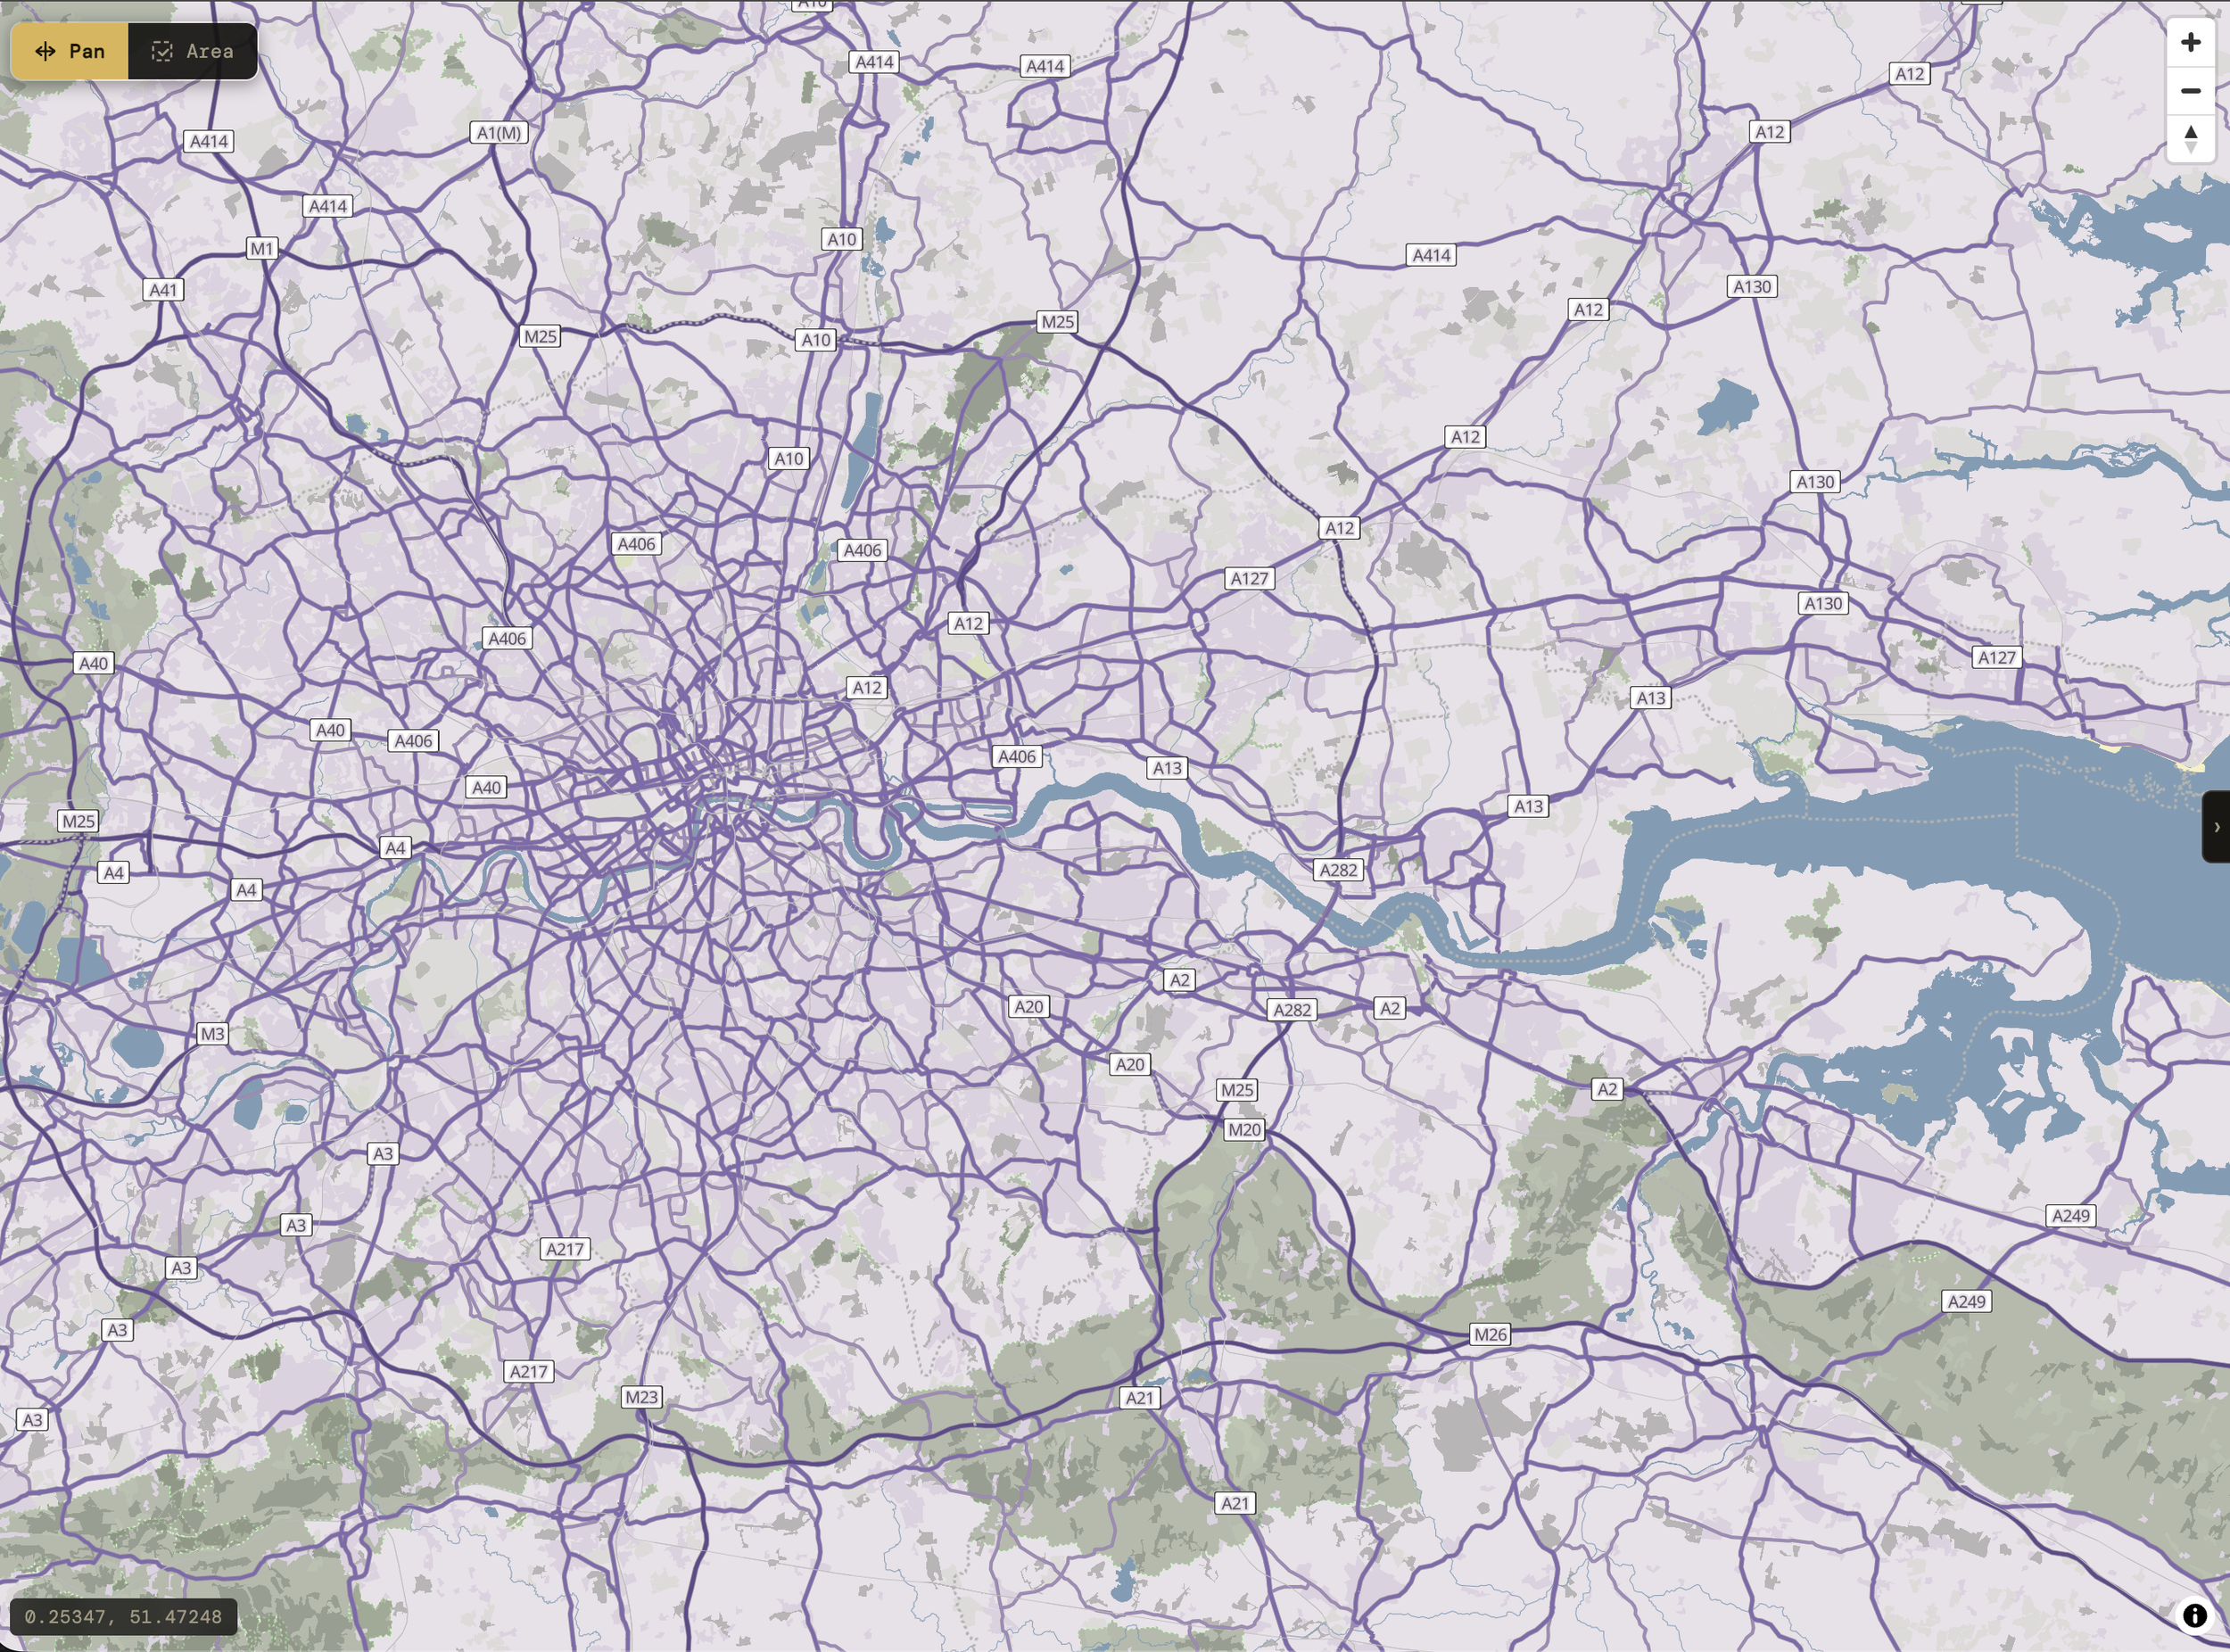
Paul Signac - Pont Mirabeau - Muted purples, dusty lavenders, and soft atmospheric tones inspired by early 20th century Parisian painting palettes. Combines poetic color relationships with restrained geographic structure.
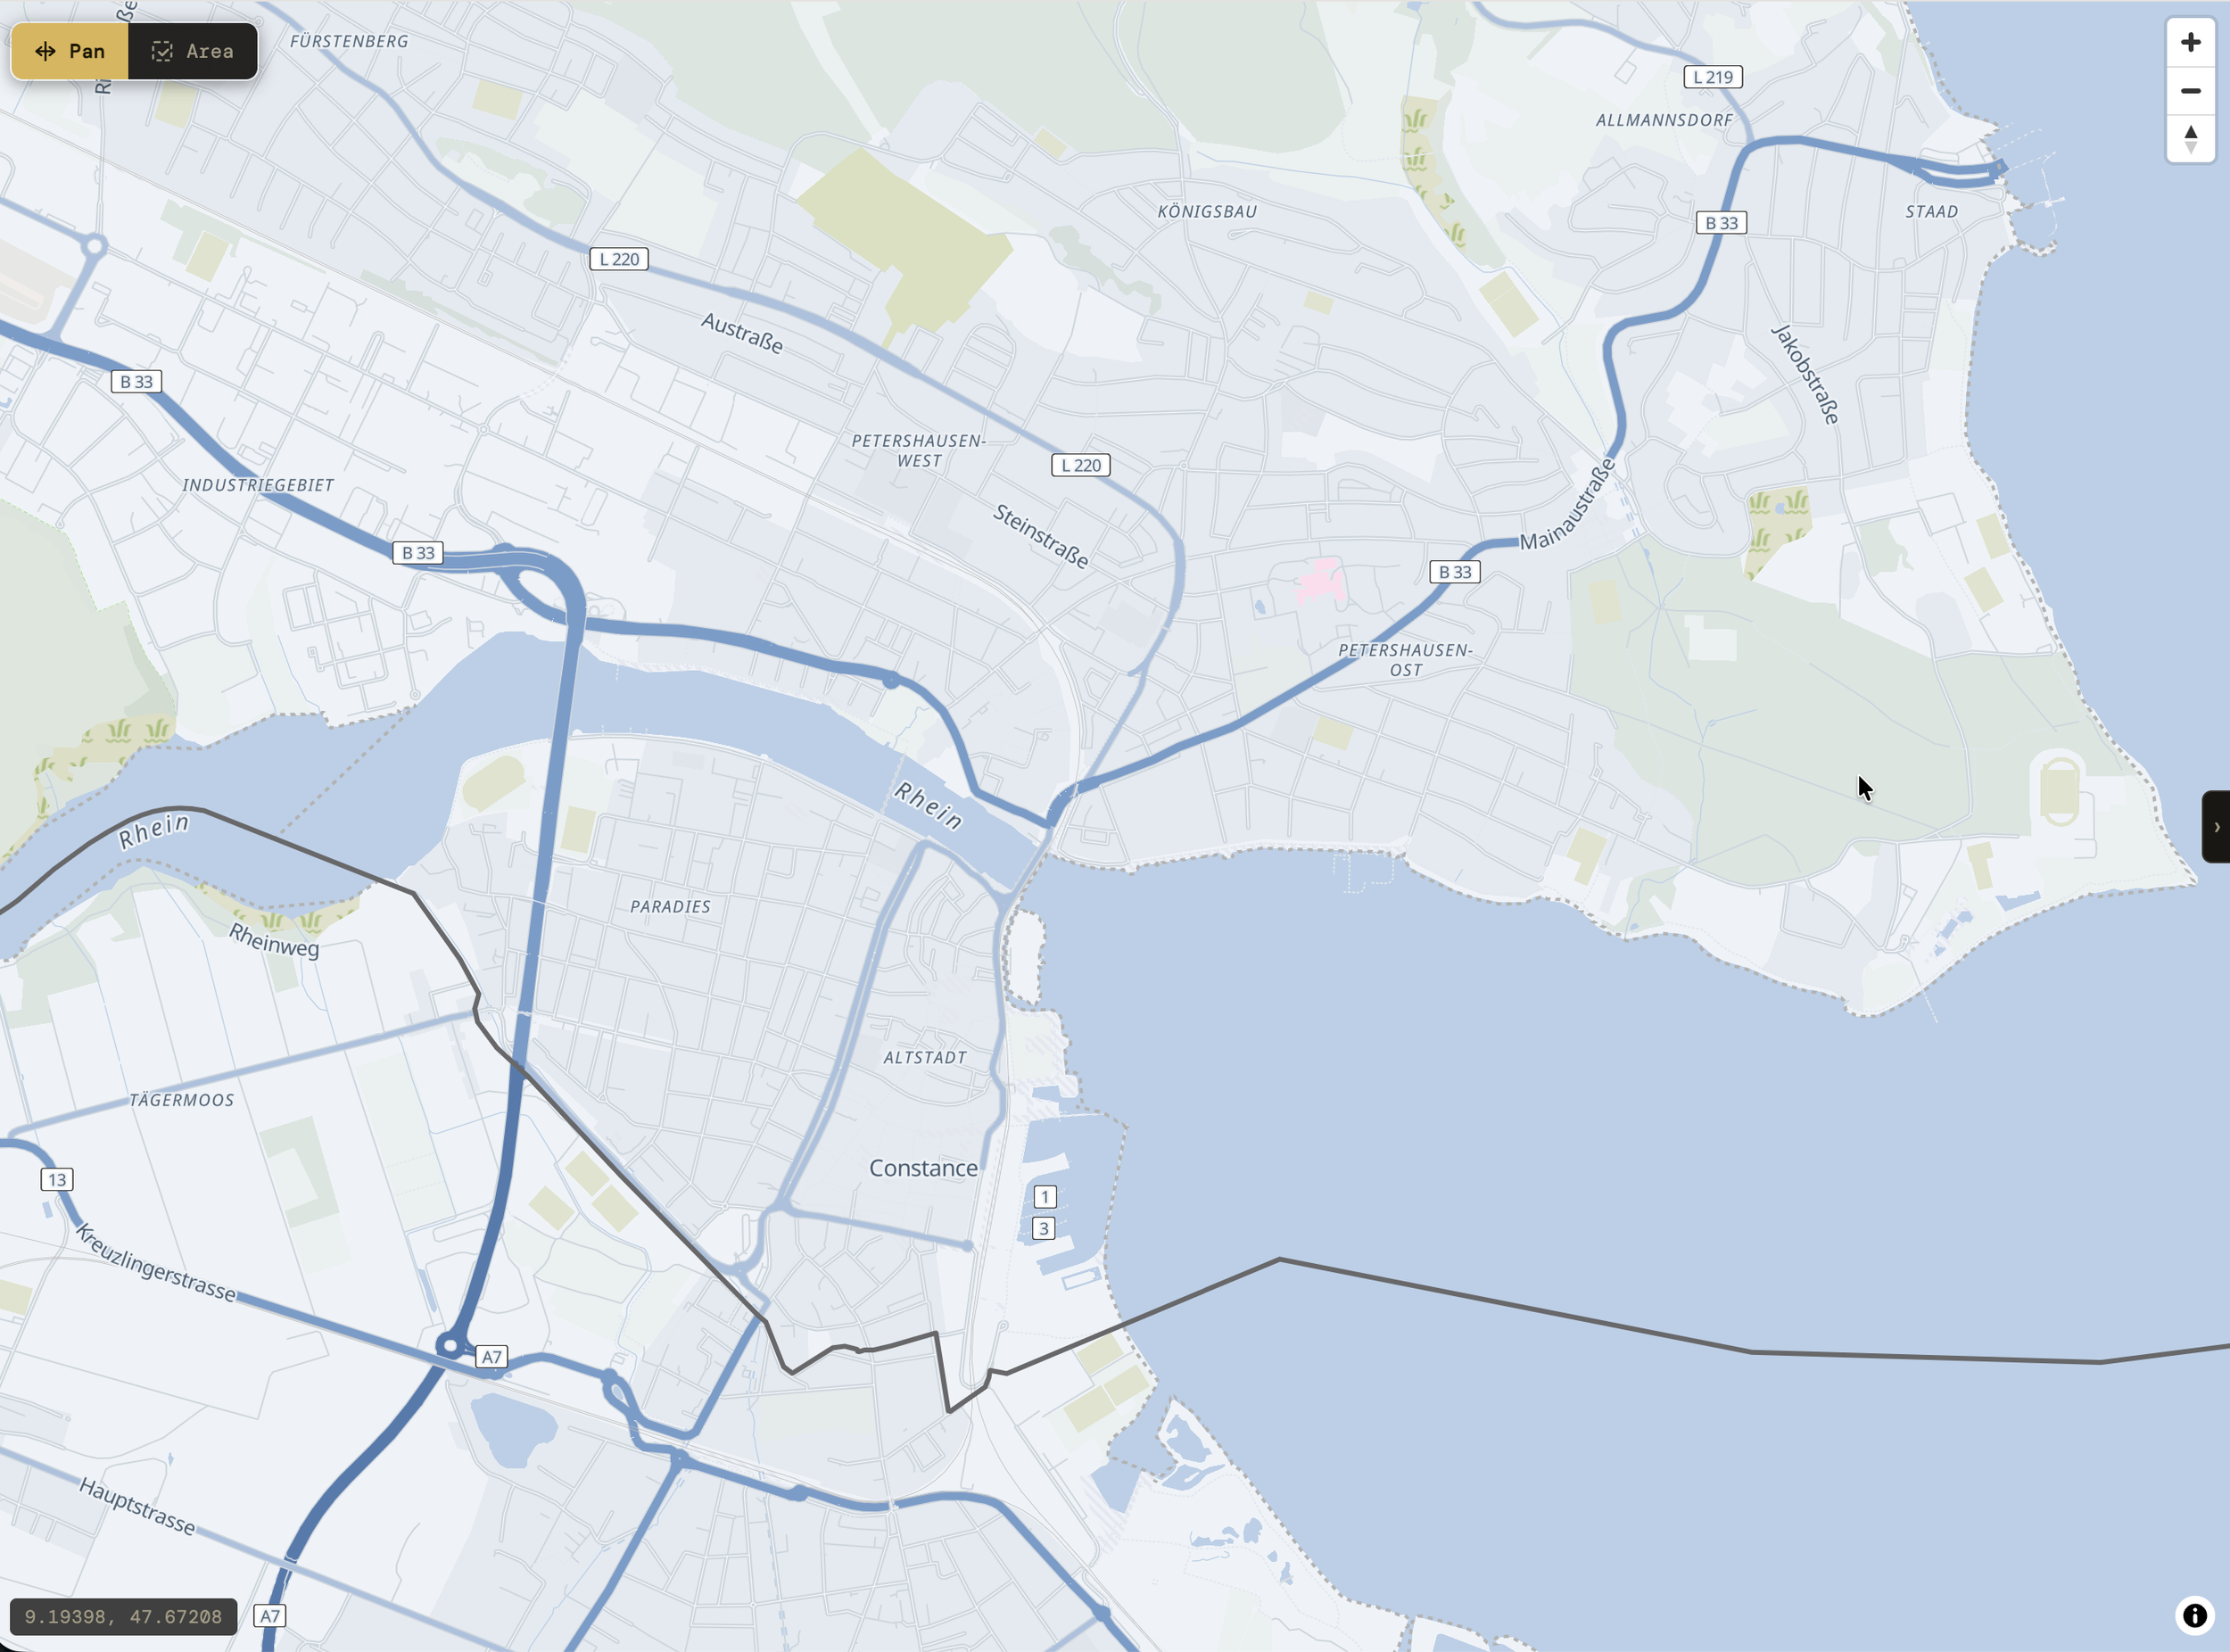
Impressionist Blue - Inspired by impressionist paintings and watercolor atlases. Soft layered blues with low visual aggression and gentle geographic structure.
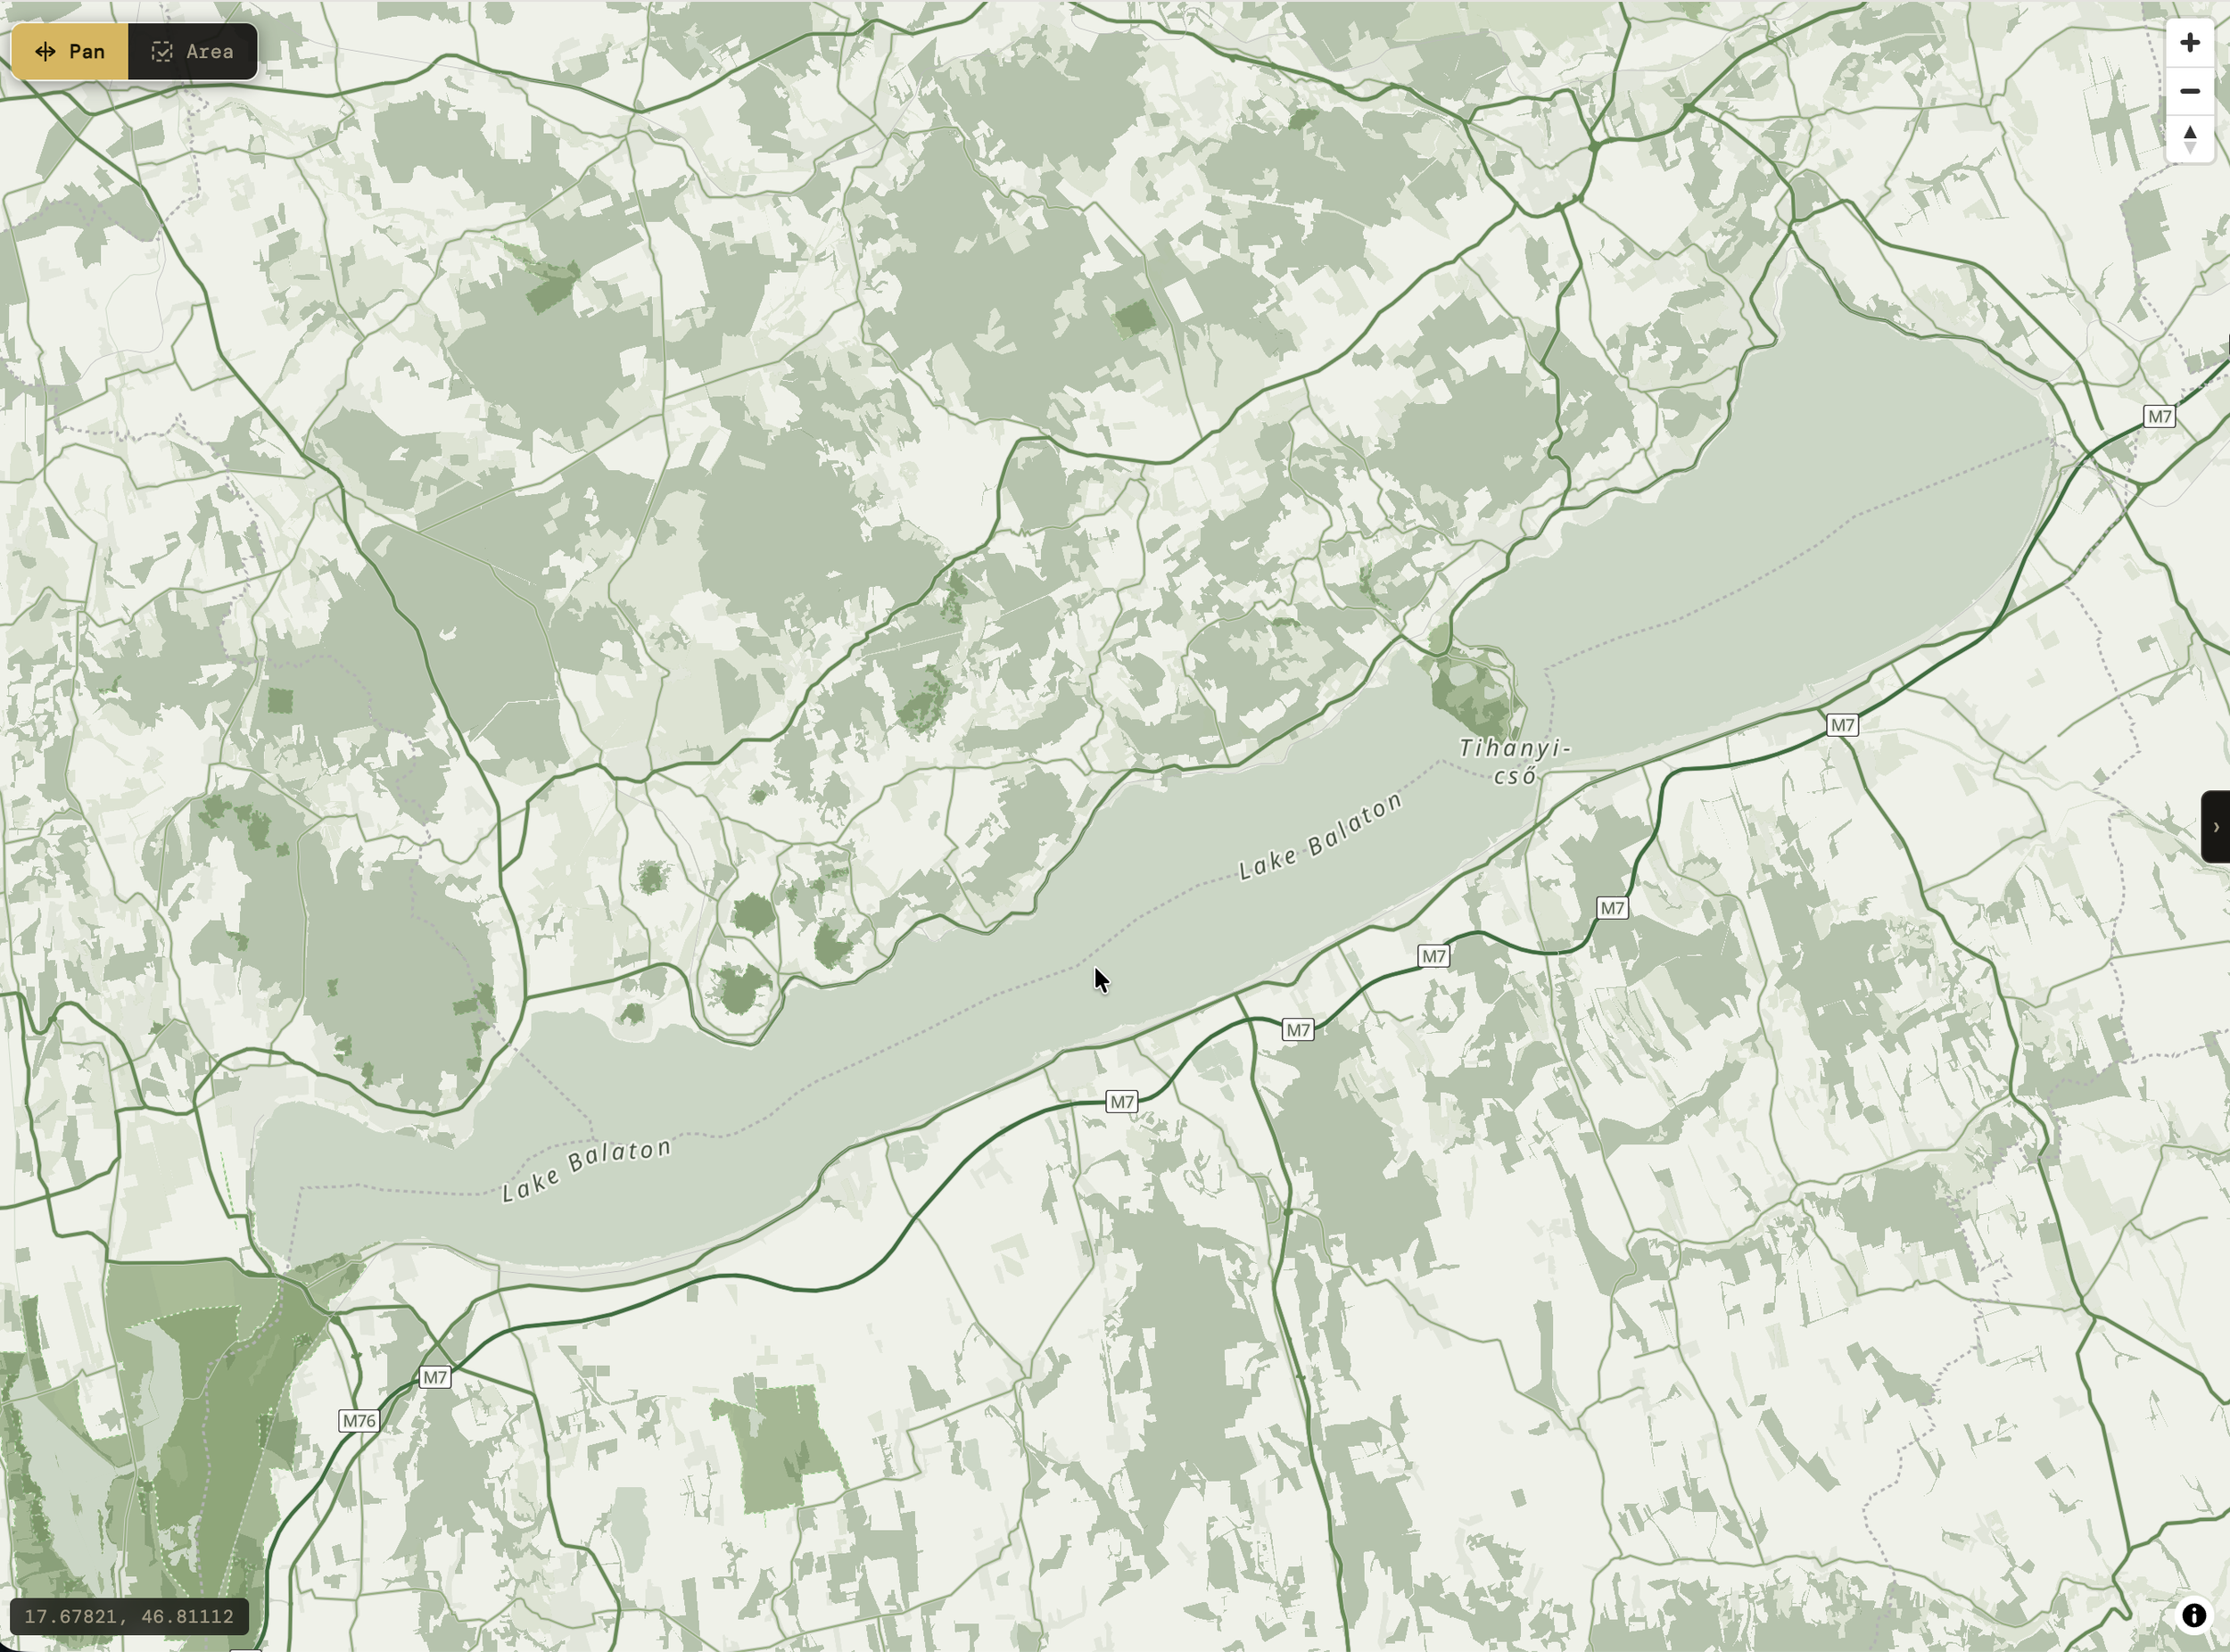
Monet - Garden - Muted greens and organic tones inspired by botanical paintings and Monet’s garden works. Particularly suited for environmental and movement visualization.
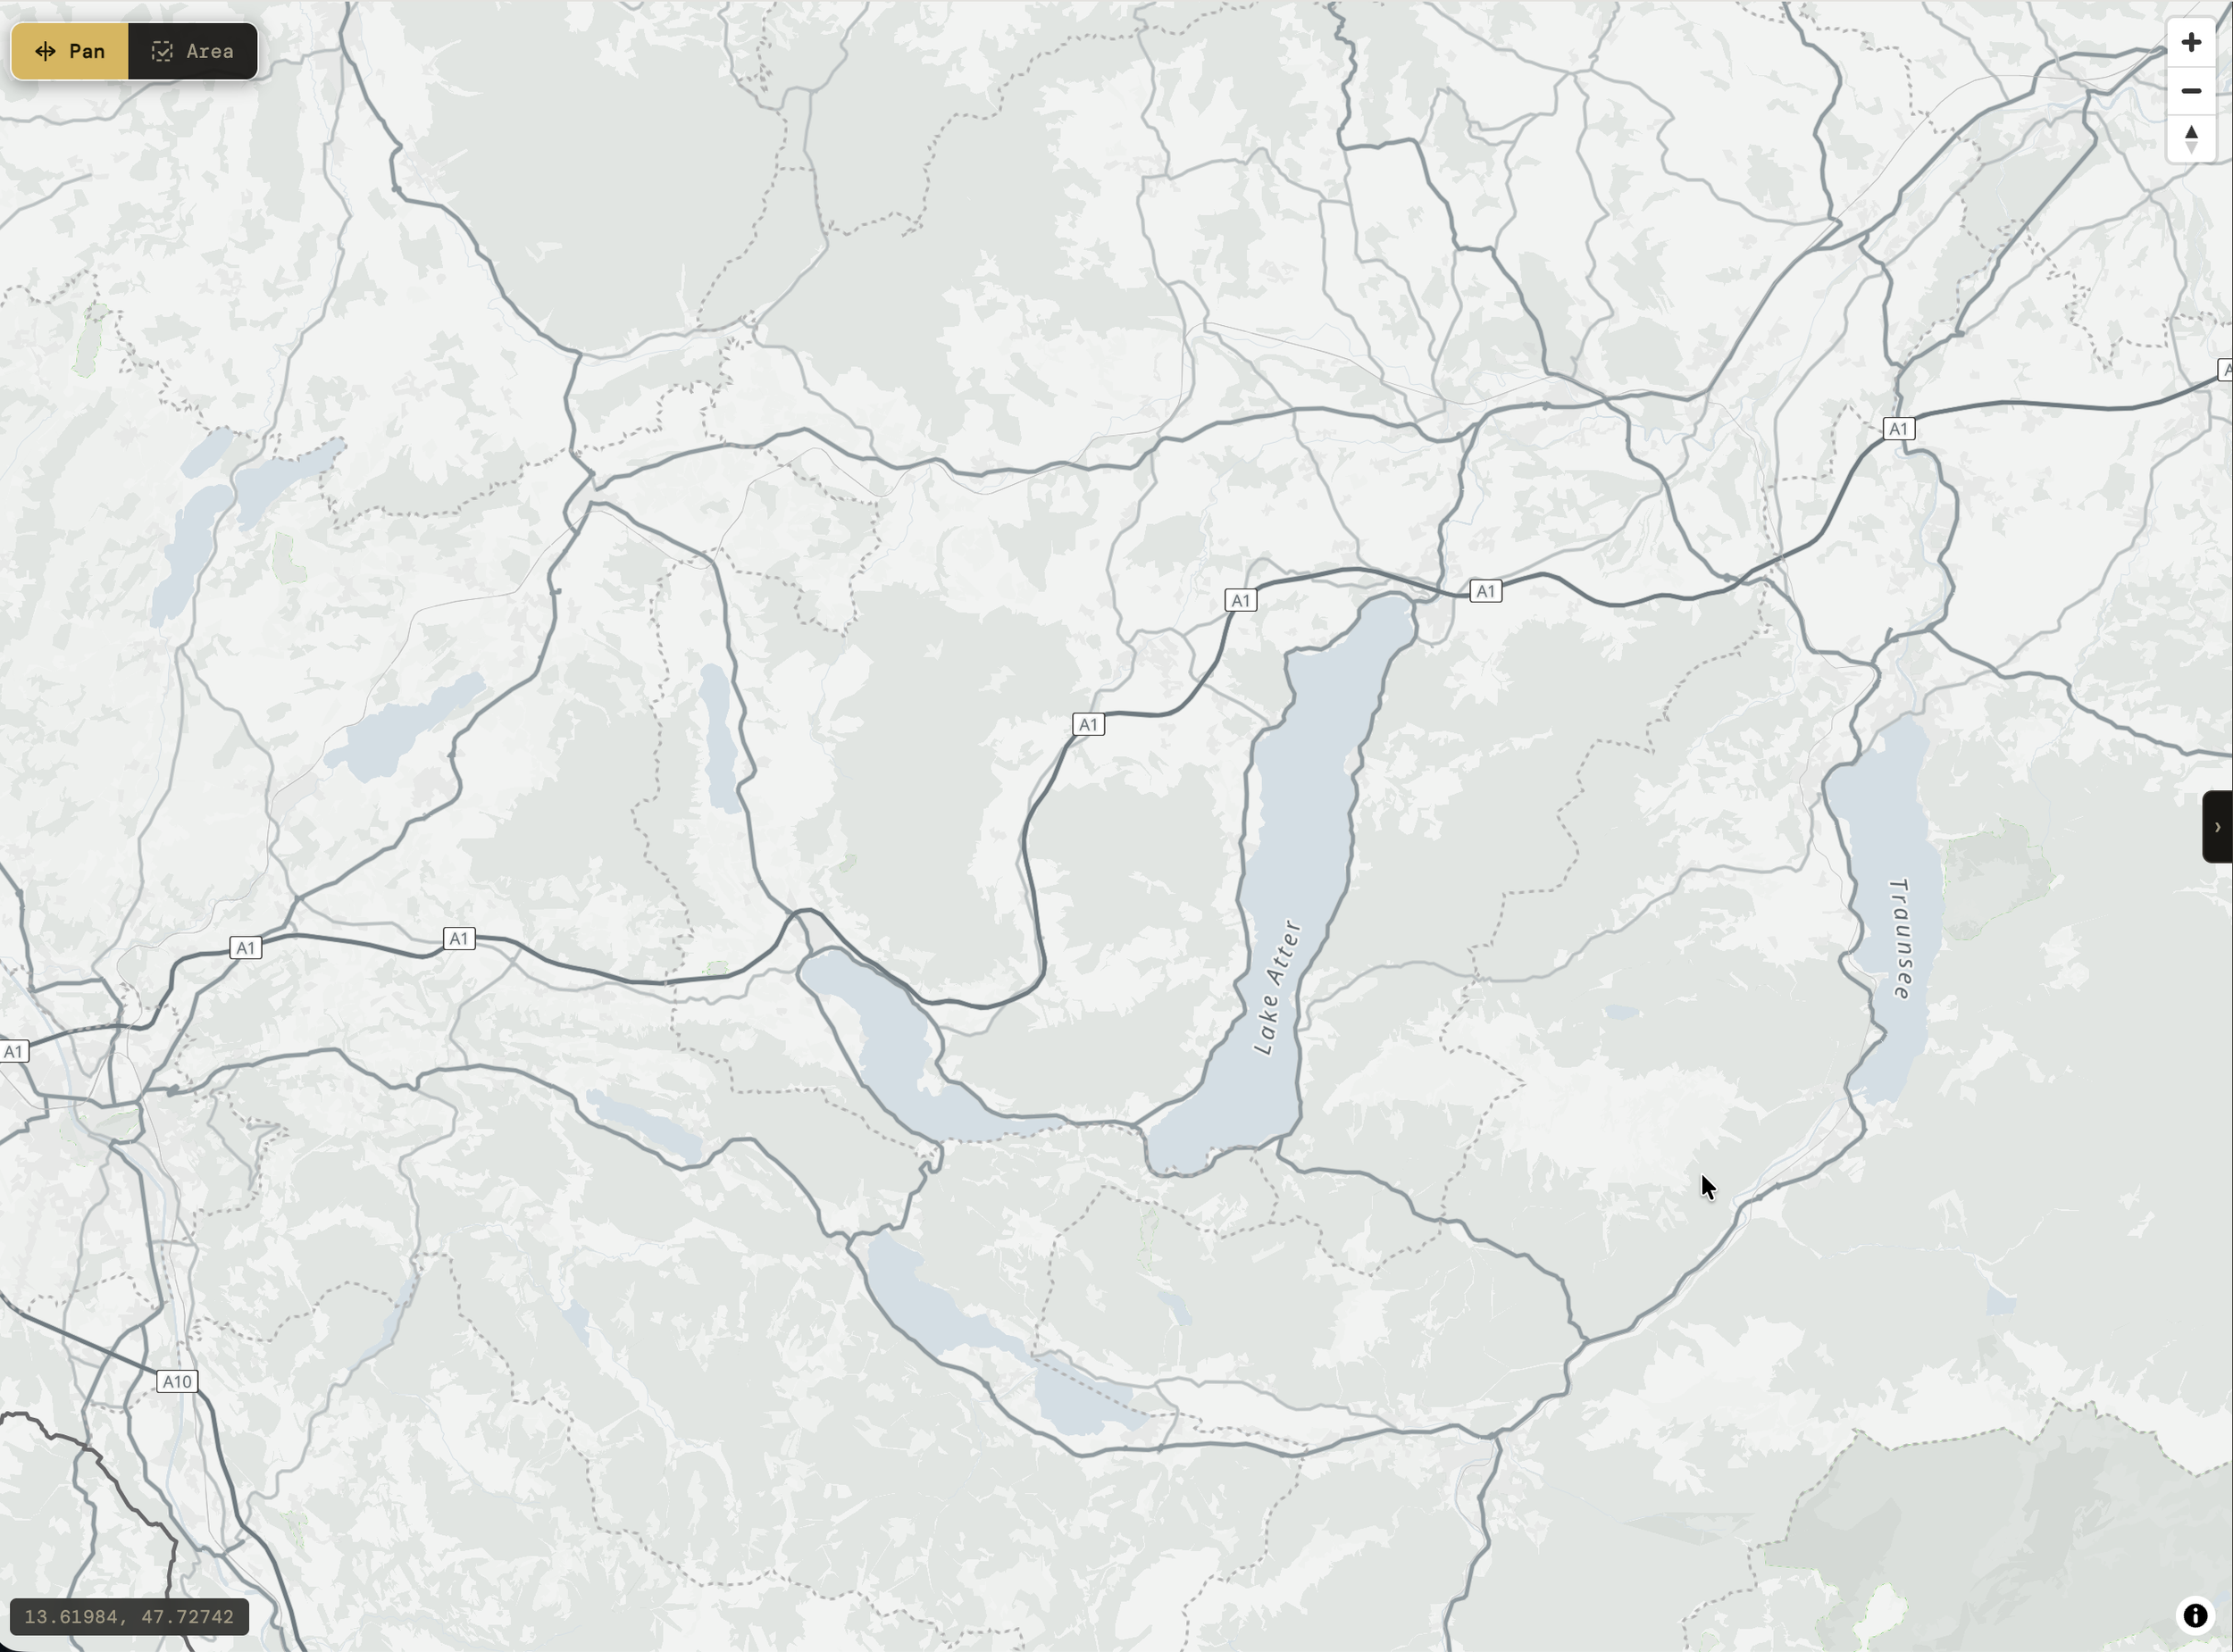
Nordic - Fog - A restrained low-contrast Scandinavian-inspired palette using cold grays and muted blues. Designed for calm analytical overlays and minimal visual interference.
Monet - Sunset- Warm terracotta, ochre, and dusty blue tones inspired by late afternoon impressionist palettes. Balanced for storytelling and editorial visualizations.
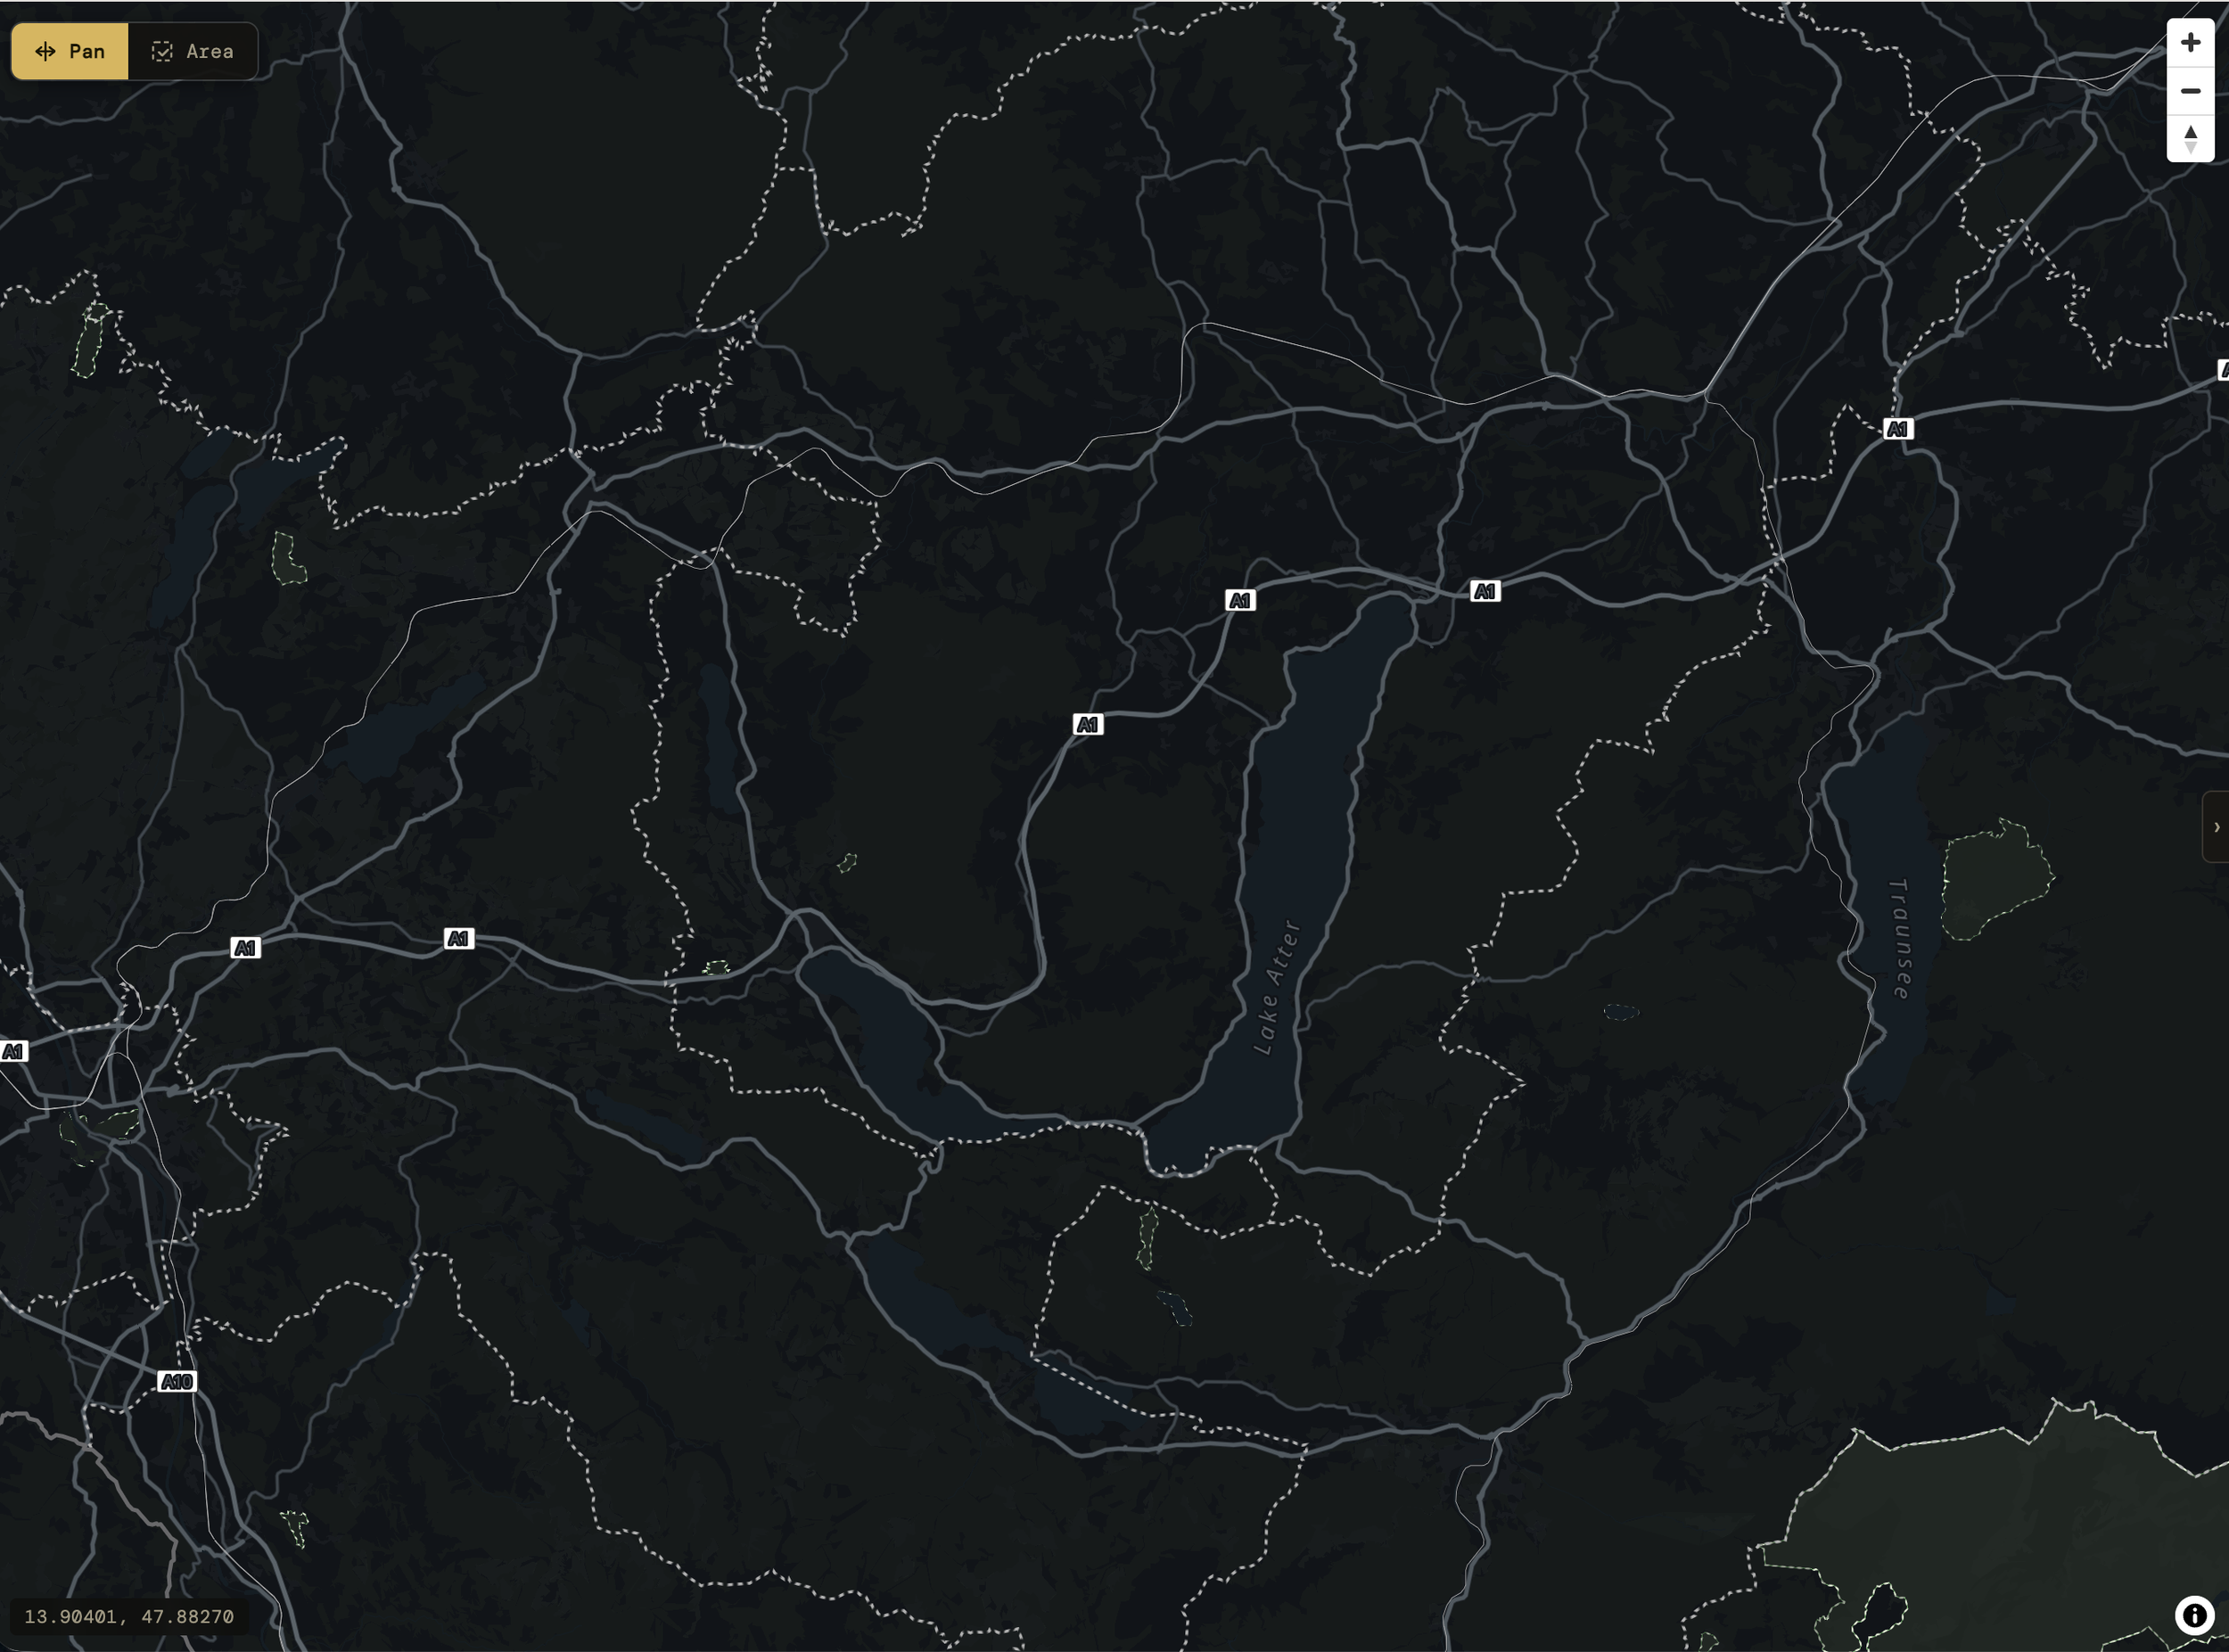
Nordic - Night - An ultra-dark atmospheric theme where roads and structures emerge subtly from near-black backgrounds. Inspired by cinematic nighttime cartography and architectural renders.
Approach
MapCraft is a fully parameterizable vector map styling and export system designed for one core idea:
maps should support the data — not interfere with it.
Default basemaps are optimized for navigation: dense labels, strong colors, visual dominance, and rich semantic detail.
But in many analytical and visualization applications, the map is only context. The actual message is the data layered on top.
Over the years, this became a recurring challenge across projects: even carefully designed visualizations become visually noisy once combined with traditional cartography. Roads compete with trajectories, land use competes with thematic overlays, labels dominate statistical encodings, and small changes in color hierarchy affect the entire perception of the visualization.
Designing a balanced cartographic style manually is extremely difficult in practice: dozens of semantic layers, color relationships, zoom visibility ranges, land use categories, labels, roads, buildings, water, contrast, and hierarchy all influence one another.
MapCraft approaches this problem differently.
Instead of treating maps as fixed basemaps, MapCraft exposes cartography itself as an interactive, editable visualization layer:
semantic zoom control per map element
visual salience tuning
fully customizable color systems
export-ready vector styling
AI-assisted cartographic generation
Users can describe an artwork, artist, atmosphere, or visual direction:
“Nordic Fog”
“Picasso Guernica”
“Van Gogh Sunflowers”
and MapCraft generates a complete cartographic theme:
colors, semantic hierarchy, and zoom visibility defaults — all directly editable in real time.
The goal is enabling designers, cartographers, or geographic data owners with AI.
AI generates an initial cartographic direction, while users refine and adapt the result interactively instead of spending hours in trial-and-error across dozens of layers.
Architecture & Technical Approach
MapCraft combines interactive web cartography, server-side vector rendering, AI-assisted theme generation, and cloud-based caching into a unified export pipeline.
The frontend is built with:
React 18
Vite
MapLibre GL JS
Zustand state management
The live map preview is fully synchronized with the export renderer, allowing users to interactively define bounding boxes, tune semantic layers, adjust visual salience, and preview AI-generated themes directly inside the browser.
The backend is implemented in:
Python
FastAPI
osmnx
geopandas
matplotlib
Shapely
Server-side rendering converts OpenStreetMap data into high-resolution PNG, SVG, and PDF exports using a fully parameterized cartographic pipeline.
AI-assisted theme generation uses OpenAI GPT-4.1 together with a constrained prompt template and a semantic map styling schema. Instead of generating arbitrary artwork, the system generates structured cartographic themes with explicit semantic meaning:
roads
land use
buildings
water
labels
zoom visibility ranges
This preserves cartographic hierarchy while allowing artistic and atmospheric exploration.
To improve performance and scalability, rendered outputs are cached in Cloudflare R2 using SHA-256 keyed requests. Identical export requests are returned directly from cache in milliseconds.
The deployment architecture combines:
Cloudflare Pages (frontend hosting)
Fly.io (backend rendering and AI services)
Cloudflare Workers + R2 (proxy and render caching)
GitHub Actions (CI/CD)
The complete rendering pipeline:
Browser (React + MapLibre GL JS)
↓
Cloudflare Pages
↓
Cloudflare Worker + R2 cache
↓
Fly.io backend
↓
matplotlib + osmnx rendering
↓
PNG / SVG / PDF export
AI theme generation follows a parallel pipeline:
Browser
    ↓
Fly.io backend
    ↓
GPT-4.1 theme generation
    ↓
Semantic theme JSON
    ↓
Live MapLibre preview update
The system is designed around one principle:
cartography should be editable, expressive, and subordinate to the visualization itself.